

Customer lifetime value calculation estimates the total revenue or profit a single customer generates across their entire relationship with a business, factoring in repeat work, renewals, and referrals. It gives Alberta service and trades businesses a real number for pricing and marketing decisions, instead of a guess based on one invoice. This guide covers the formulas, the step-by-step process, and the mistakes that quietly skew results.
Most Alberta service and trades businesses price the next job, collect the invoice, and move on without ever asking what that customer might be worth over the next five or ten years. That single-transaction mindset costs money, because it ignores repeat contracts, maintenance renewals, and referral business that often dwarf the original invoice. A proper customer lifetime value calculation fixes this blind spot by attaching a real number to the full customer relationship rather than just the first sale. Without it, marketing budgets, pricing decisions, and even staffing plans get built on guesswork, and that guesswork gets more expensive as a company scales.
This article walks through the customer lifetime value formula options available, from the basic historic version to profit-based and predictive models, along with a step-by-step process for gathering accurate inputs. It also covers frameworks like the customer profitability matrix, RFM analysis (recency, frequency, monetary value), cohort analysis, and the Pareto principle, since roughly 20% of customers often generate 80% of profit, and shows how the resulting figure should guide marketing spend once it’s calculated. Cutting Edge Digital Marketing works with construction, industrial, and trades companies across Alberta on exactly this kind of data-driven marketing planning, and the sections below reflect what actually works in the field. If your business needs help turning this number into a growth plan, contact us to get started.
Key Takeaways
Customer lifetime value calculation reveals what a customer is truly worth across the full relationship, not just one job or invoice.
Three core formulas exist, the basic historic model, the profit-based model, and the predictive churn-based model, and each suits a different level of data sophistication.
A healthy CLV-to-CAC ratio is generally 3:1 or higher, meaning three dollars of lifetime value for every dollar spent acquiring the customer.
Segmenting CLV by service type, acquisition channel, or region, using tools like RFM analysis or a customer profitability matrix, uncovers which relationships are actually the most profitable.
Accurate tracking infrastructure, not the formula itself, is the prerequisite most businesses overlook before attempting this calculation.
Table of Contents
- What Is Customer Lifetime Value Calculation?
- Core Components You Need Before Calculating CLV
- Customer Lifetime Value Formula: Three Ways to Calculate It
- Step-by-Step Process for Calculating CLV Accurately
- Common Mistakes That Skew Your CLV Calculation
- Turning CLV Into a Marketing and Growth Strategy
- The Bottom Line
- Frequently Asked Questions
What Is Customer Lifetime Value Calculation?

Customer lifetime value calculation is the process of estimating the total revenue or profit a single customer will generate across their entire relationship with a business, rather than measuring just one transaction. It shifts attention away from a single job or invoice and toward the full pattern of repeat work, contract renewals, and referrals a client brings in over years, not weeks, a shift that aligns with treating net retention as a north star metric rather than an afterthought. For a mechanical contractor or an industrial equipment supplier, that pattern can span a decade or more, and the resulting figure gives owners a factual basis for pricing and marketing rather than a rough guess.
Repeat contracts, maintenance agreements, and referral activity make this calculation especially valuable for construction, trades, and industrial businesses, where the first invoice rarely tells the whole story. A commercial client who signs a multi-year maintenance agreement is worth far more than that opening invoice suggests, and calculating that fuller value changes how much a business can justify spending to win similar clients. It also exposes which customer types deserve the most attention and investment going forward, rather than treating every lead the same. Businesses with recurring service contracts can borrow a page from SaaS companies here, since concepts like monthly recurring revenue and subscription-based forecasting map directly onto maintenance agreements and service plans.
Core Components You Need Before Calculating CLV
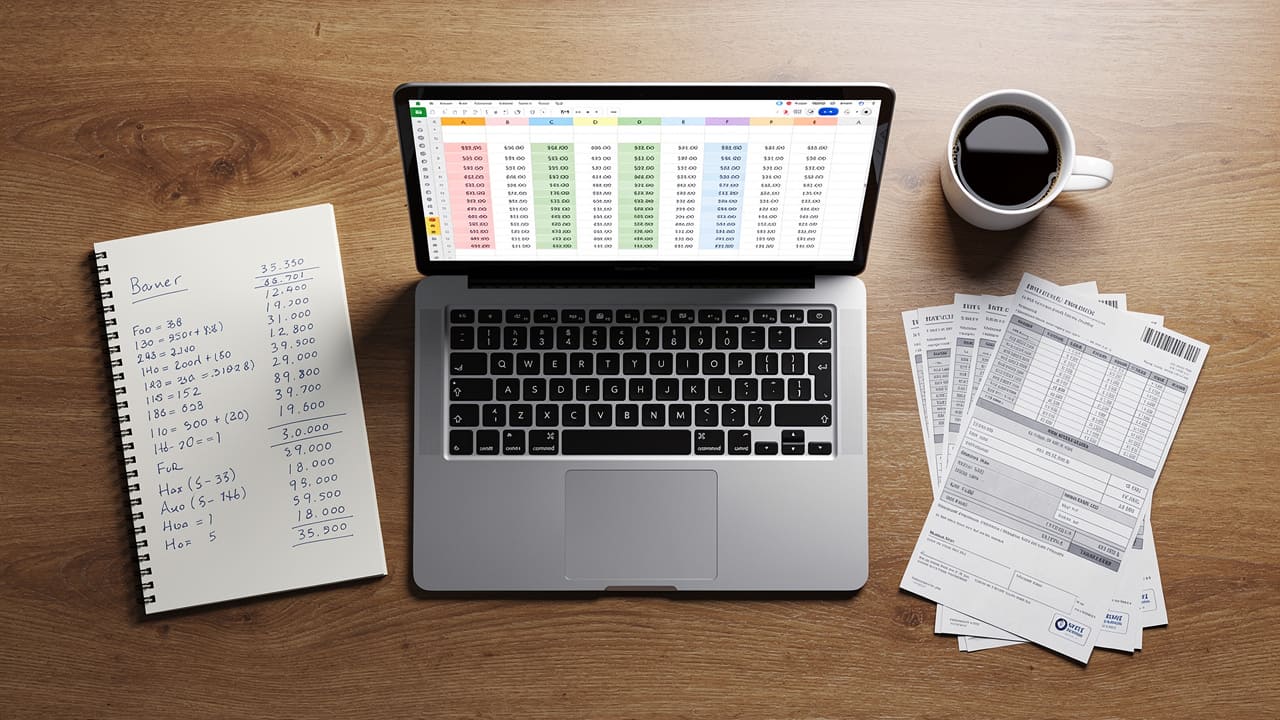
Every version of the customer lifetime value formula depends on a handful of inputs, and gathering them accurately matters more than which formula you eventually choose. The essential building blocks are average purchase value, which is total revenue divided by number of transactions, and average purchase frequency, which is transactions divided by unique customers. Multiply those two together and you get customer value, the revenue a typical client generates in a given year. From there, average customer lifespan estimates how many years a customer keeps buying before they churn, while gross margin converts that revenue figure into something closer to real profit. More advanced calculations also draw on churn rate and a discount rate, since money earned five years from now is worth less than money earned today under net present value theory, along with a payback period that shows how long it takes to recover the cost of acquiring a customer.
Missing or unreliable data at this stage undermines every formula that follows, no matter how sound the math looks on paper, and reviewing contractor financials at scale shows that the median gross margin actually lands at 40 to 45%, well above the commonly cited 35% figure many businesses still use in their calculations.
Where This Data Actually Comes From
These inputs typically come from invoicing records, CRM software, and accounting systems, and pulling data across a one to three year window produces more statistically reliable averages than a single quarter. Cohort analysis, which groups customers by the month or year they were acquired, helps separate genuine trends from short-term noise in this data. Businesses without proper tracking infrastructure, meaning website analytics, CRM integration, and clear lead attribution, often struggle to produce reliable inputs at all, which is usually the real barrier to accurate customer LTV analysis rather than the formulas themselves.
Customer Lifetime Value Formula: Three Ways to Calculate It

There isn’t one single CLV formula; there are three common approaches, and the right one depends on how much historical data a business has and how predictable its revenue already is. The basic formula relies purely on historic averages and works well for businesses with straightforward, project-based revenue. The profit-based formula layers in margin so the result reflects real bottom-line value instead of top-line revenue, which matters considerably in industries where material and labour costs eat into every job. The predictive formula, built around churn and retention rates, suits businesses running maintenance agreements or ongoing service contracts, where forecasting future value matters as much as understanding the past, much like an ARR-style approach used by subscription and recurring-revenue businesses.
| Formula Type | Best Suited For | Core Formula |
|---|---|---|
| Basic (Historic) | Project-based trades and contractors | APV × Frequency × Lifespan |
| Profit-Based | Material- and labour-heavy industrial work | Basic CLV × Profit Margin |
| Predictive (Churn-Based) | Maintenance agreements, service contracts | (APV × Frequency ÷ Churn Rate) × Margin |
Basic CLV Formula (Historic Method)
The basic customer lifetime value equation multiplies average purchase value by purchase frequency, then by average customer lifespan, using only historical transaction data. Consider a commercial HVAC contractor with an average job value of $2,500, a figure well within range when checked against an HVAC cost benchmark, where the typical client books service twice a year and stays with the company for six years on average. Customer value comes to $5,000 annually, and multiplying that by a six-year lifespan produces a CLV formula result of $30,000. That figure reframes the conversation entirely, since a $2,500 job suddenly represents a $30,000 relationship once repeat visits are counted.
Profit-Based CLV Formula
The profit-based version multiplies that basic CLV figure by gross profit margin, converting a revenue number into something closer to actual bottom-line value. Applying a 35% margin to the $30,000 HVAC example above produces a profit-based CLV of $10,500, which is the more honest number for setting acquisition cost limits. This distinction matters considerably more for material- and labour-heavy industrial businesses, where two jobs of identical revenue can carry very different profitability depending on crew size, equipment costs, and material pricing at the time.
Predictive CLV Formula (Using Churn Rate)
The predictive lifetime value formula replaces a fixed lifespan estimate with churn rate, calculated as one minus retention rate, which better suits contract-based revenue. If that same business retains 80% of its customers annually, churn sits at 20%, and dividing the $5,000 annual customer value by 0.20 before applying the 35% margin produces a predictive CLV of $8,750. Predictive modelling outperforms historic averages whenever a business runs maintenance agreements or ongoing service contracts, since it accounts for the reality that not every customer renews.
Step-by-Step Process for Calculating CLV Accurately
Turning these formulas into a repeatable process starts with pulling one to three years of sales data from invoicing, CRM, or accounting software, since a short data window produces unreliable averages, especially for seasonal trades. From there, calculate average purchase value and purchase frequency, determine average customer lifespan or churn rate, and select whichever formula, basic, profit-based, or predictive, best matches the data available and the business model in question. Once a figure exists, compare it against customer acquisition cost to check whether current marketing spend produces a sustainable return, and check the payback period to see how many months of revenue it takes to cover that acquisition cost.
Segmenting the analysis by service type, acquisition channel, and geography prevents a single blended average from hiding important differences between customer groups. Building a customer profitability matrix, which plots customers by revenue against cost to serve, or applying RFM analysis (recency, frequency, monetary value) adds another layer of precision to this segmentation. A construction company might discover that commercial clients acquired through referrals carry a dramatically higher customer lifecycle value than residential jobs won through paid advertising, and that distinction should shape where future marketing dollars go. CLV isn’t a one-time exercise either; revisiting the calculation quarterly or annually keeps it aligned with current pricing, retention rates, and market conditions.
Common Mistakes That Skew Your CLV Calculation
The most common error is pulling data from too short a window, which produces misleading averages for businesses with seasonal or infrequent purchase cycles, such as construction firms that see most of their volume in warmer months. Ignoring profit margin entirely and relying on revenue alone is another frequent mistake, since it overstates true customer value in industries where material and labour costs vary widely between jobs. Skipping segmentation altogether masks the difference between high-value and low-value customer groups, and failing to update the calculation regularly leaves a business making decisions based on outdated pricing and retention assumptions.
Overlooking acquisition cost entirely is perhaps the most expensive mistake of all, since it prevents a business from ever knowing whether its marketing spend generates a profitable return. A business might calculate an impressive CLV figure and still lose money on every new customer if the cost to acquire them was never factored into the equation at all. Ignoring the Pareto principle is another blind spot: many businesses find that roughly 20% of customers drive 80% of profit, and treating every account as equally important dilutes attention away from the relationships that matter most.
A CLV figure is only as useful as the acquisition cost it’s measured against — without that comparison, even an impressive number can hide a money-losing customer relationship.
Turning CLV Into a Marketing and Growth Strategy

Once a business has a reliable lifetime value calculation, it becomes the foundation for setting cost-per-lead targets, evaluating the CLV-to-CAC ratio against the commonly cited 3:1 benchmark, and deciding how aggressively to invest in retention versus new customer acquisition, a decision that matters more than it seems since even median net revenue retention around 101% can mask serious churn problems. A business that knows its average client is worth $30,000 can justify a considerably higher cost per lead than one still pricing marketing around a single $2,500 job, and that distinction changes what an appropriate monthly marketing budget actually looks like.
Cutting Edge Digital Marketing builds proper tracking into websites, paid advertising campaigns, and broader marketing systems from the outset, so the data needed for this kind of calculation actually exists rather than being reconstructed after the fact. Because every client’s sales cycle, contract structure, and customer relationship pattern differs, the team at Cutting Edge Digital Marketing shapes strategy accordingly rather than applying a templated package, which gives trades, construction, and industrial businesses the data foundation accurate CLV work genuinely requires. Learn more about how this approach applies to your business.
The Bottom Line

Customer lifetime value calculation replaces guesswork with a defensible number that should inform pricing, marketing budgets, and retention investment across the business, rather than sitting in a spreadsheet nobody revisits. Choosing the right formula, basic, profit-based, or predictive, matters less than maintaining clean, segmented data that reflects how the business actually operates and sells. A construction firm running one-off residential jobs needs a different approach than an industrial supplier managing multi-year maintenance contracts, and forcing either into the wrong model produces numbers nobody should trust. Partnering with a marketing team like Cutting Edge Digital Marketing, one that builds proper tracking and strategy around long-term customer value rather than optimizing purely for lead volume, is what turns this calculation from an academic exercise into a genuine growth tool.
Frequently Asked Questions
Question: What is a good customer lifetime value benchmark for a small business?
There’s no universal benchmark that applies across industries. Instead, compare CLV against your own customer acquisition cost using the 3:1 CLV-to-CAC ratio, which indicates sustainable, profitable growth regardless of company size or sector.
Question: How often should I recalculate customer lifetime value?
Recalculate quarterly or annually, since pricing changes, retention shifts, and evolving market conditions can all move the underlying inputs. Businesses with seasonal demand should lean toward annual recalculation for more statistically reliable averages.
Question: Can I calculate CLV without CRM software?
Yes, invoicing and accounting records alone can support a basic customer lifetime value calculation. A CRM significantly improves and makes segmenting by customer type, region, or channel far easier over time.
Question: What’s the difference between CLV and average order value?
Average order value measures a single transaction, while CLV multiplies that figure by purchase frequency and customer lifespan to capture total relationship value. One reflects a moment; the other reflects the full customer relationship.
Question: How does seasonality affect CLV calculations for trades businesses?
Seasonal demand can distort purchase frequency if measured over too short a window, making a busy summer look like a permanent pattern. Using a full year or longer smooths out these swings for more accurate averages.
Question: Should I calculate CLV per customer or per segment?
Segment-based calculation, by service type, acquisition channel, or region, is generally more useful than a single blended figure. It reveals which customer groups drive the most value instead of hiding that detail inside a company-wide average.